Recently, BCcampus has created some additional reports that seek to help answer questions about users who are submitting applications to more than one post-secondary institution. These reports were run for the time period October 1, 2010 to September 30, 2011.
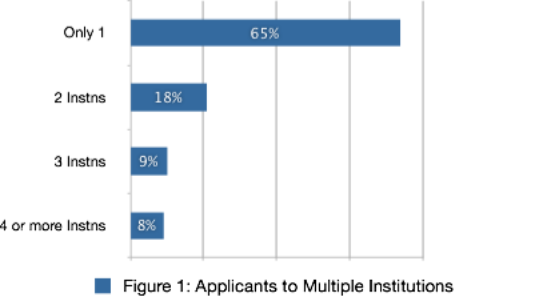
Figure 1 shows that overall, 35% of the nearly 100,000 applicants who used ApplyBC submitted applications to more than one institution.
It’s possible that the rate (of multiple applications) is higher because some institutions do not refer applicants to the ApplyBC service. For example, if someone applied first to UBC and then to SFU, this report would show that that individual only applied to SFU, because we do not have the data from UBC in this case. However, if he/she applied first to SFU, and subsequently sent an application to UBC through the ApplyBC service, that data would be captured in these reports.
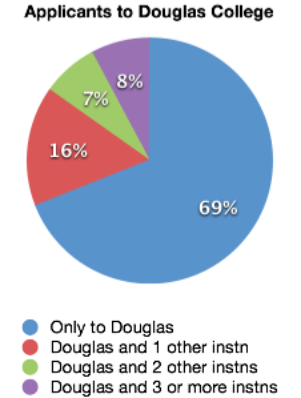
Figure 2: Applicants to Douglas College
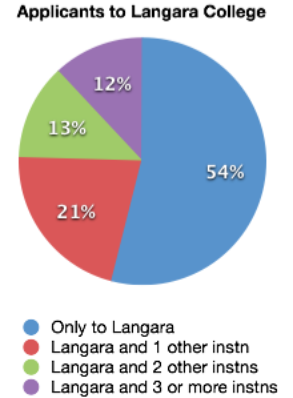
Figure 3: Applicants to Langara College
Figures 2 and 3 above shows some significant differences in applicant behaviour between those applying to Douglas College and those applying to Langara College. Certainly, further reporting work could be undertaken to determine how or if program availability might be a factor in selection. Similarly, analysis between different sending high schools, ages, and the fact that Kwantlen no longer refers applicants to the ApplyBC system, could provide further insight into these differences.
The following two charts (Figures 4 and 5) show how patterns differ across different regions of the province: Vancouver Island and Metro Vancouver – these charts were also created for the rural colleges, but are not shown because only 16% of the applicants to those institutions also apply to other institutions.
In these charts, the institution:institution bars indicate the number of people who applied only to that corresponding institution, and the other colours represent the number who also applied to a different institution. People who applied to more than two of these institutions would be represented in each corresponding colour.
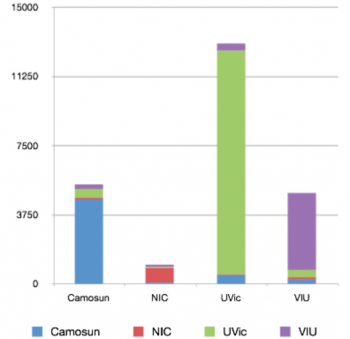
Figure 4: Multiple applications across most Vancouver Island Institutions
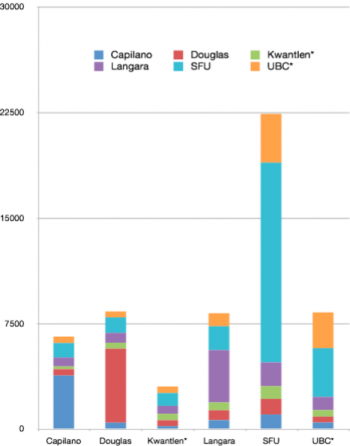
Figure 5: Multiple applications across some Metro Vancouver Institutions
There is quite a difference between the Vancouver Island and Metro Vancouver behaviours, representing the larger choice of institutions in the Metro region.
This brief analysis demonstrates the value of a more comprehensive data source that would enable further analysis by program, across multiple years, and regions. Because of the real-time nature of the data, it would be possible to perform analysis during recruitment periods, to help pinpoint areas of high and low demand, which in turn could help make needed decisions to best benefit prospective students.
In this regard, BCcampus has developed a straightforward way that institutions can easily provide applicant data (not containing any personally identifiable attributes) on a daily basis, so that these reports can provide a complete and up-to-date reporting capability. We will be working towards accomplishing this with all institutions during the coming year.
Published December 8, 2011Posted by Randy Bruce0 Comments