By the numbers: top 9 stats you need to know about Kaltura right now


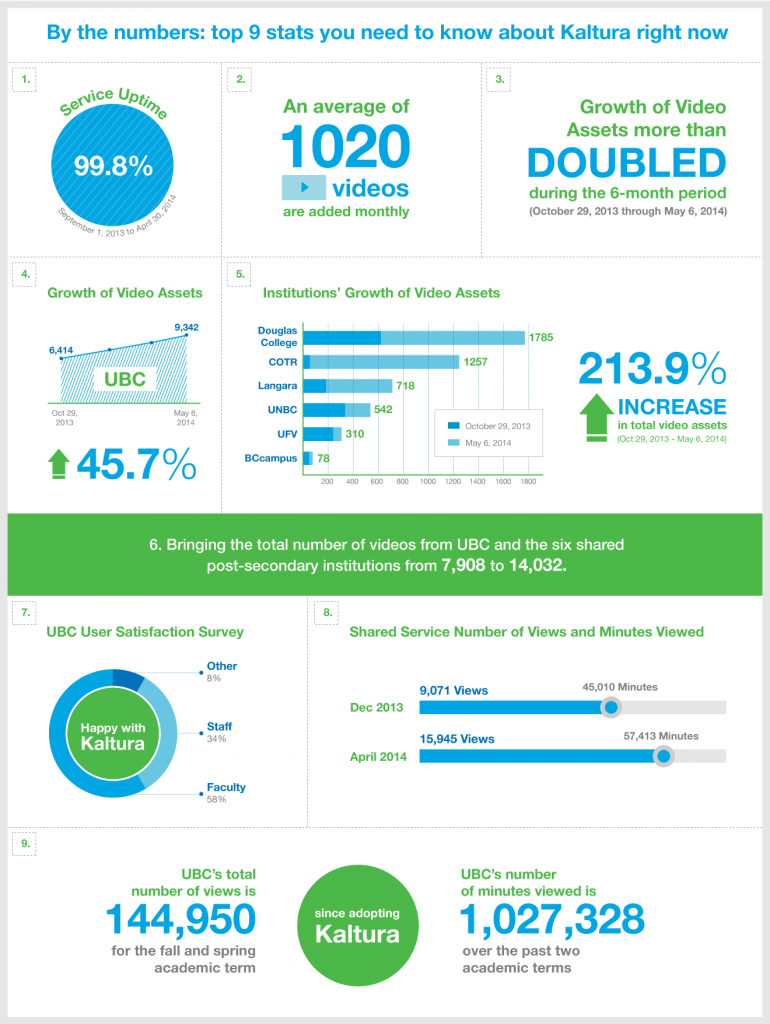
1.	99.8% service uptime from September 1, 2013 to April 30, 2014. 2.	An average of 1020 videos are added to the system each month  3.	Growth of Video Assets more than doubled during the 6-month period (October 29, 2013 through May 6, 2014):  4.	Total for UBC from 6414 video assets to 9342.  5.	Total for the six participating post-secondary institutions from 1494 to 4690. 6.	Bringing the total number of videos from UBC and the six shared post-secondary institutions from 7908 to 14,032.  7.	People like using the service. A UBC User Satisfaction Survey tells us 58% of faculty and 34% of staff are happy with Kaltura.  8.	Shared Service Number of Views and Minutes Viewed:  The total number of views for the shared service participating institutions rose significantly from 9071 at the end of December 2013 to 15,945 at the end of April 2014.   The total number of minutes for the shared service participating institutions also grew significantly from 45,010 at the end of December 2013 to 57,413 at the April 2014 .   9.	The total number of views from videos assets for the fall academic term and spring academic turn is staggering at 144,950. UBC has also seen an exponential growth in the number of minutes viewed over the past two academic terms for a total of: 1,027,328 – that’s well over 1 million minutes viewed since adopting Kaltura.


To find out how your post-secondary institution can adopt Kaltura for its video asset management, contact Denise Goudy from BCcampus at dgoudy@bccampus.ca

Like our infographic? It (along with all our other content) is Creative Commons-licensed. So feel free to re-use and re-mix, as long as you give us the credit.

Learn more: